Inspired by a Question from the Sadler Mathematics Methods Text book and some photos Mr Woo shared recently, I undertook an activity with my class. I broke the students in to groups. Each received
- 1 set of scissors,
- 1 glue stick,
- 1 ruler,
- 6 pieces of colourful A4 paper.
and kindly lent from the Science Dept:
- 1 set of digital scales and
- 1 bottle of plastic fragments (but could use sand, rice or grains)

The first task was for students to convert the 6 pieces of A4 paper into 6 different sized boxes/baskets. This involved cutting squares of various sizes from the four corners (with the students measuring each square to be a set number of centimeters. (The larger the square the deeper the box.)

Students then put their boxes one by one on top of a set of scales and poured in plastic fragments. Once the students had documented the weight of the bits that each box could hold, they plotted these coordinates (with x being the size of the corner squares in cm, and y being the weight in grams)
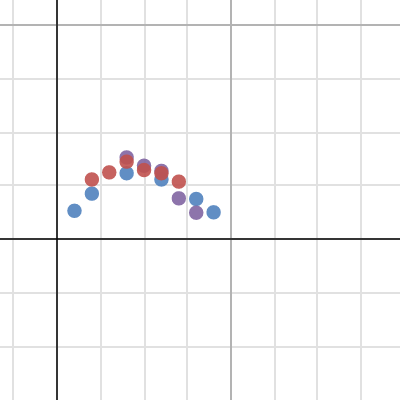
Above is the points plotted by the students (different colours for different groups) As the examples above shows, after ~4cm the capacity of the box is reducing for any increase in size of the corner squares. This was good, but the real learning was yet to come.
Next we looked at the formula for the volume of each box. Students were able to recall the volume of a rectangular prism (from Year 8) is equal to length by width by height. We took one side of the corner square and labelled it "x", given A4 page is 21cm x 30cm, they identified that volume must be:
Height: x
Length: 30 - 2x
Width: 21 - 2x
Volume: x(30-2x)(21-2x)
Height: x
Length: 30 - 2x
Width: 21 - 2x
Volume: x(30-2x)(21-2x)
Students graphed this function on top of the plotted points, and found that they didn't match. Why?

Much discussion, starting with students blaming the tools, then blaming each other and even blaming the graphing software. Until one pointed out that they were graphing different things.
The coordinates are the weight, and the function is volume.
As students realised this I asked how could we convert from volume to weight (covered in Year 9).
"We never learnt the formula to change between Weight and Volume" Really? Did anyone?
"I think that 1 litre weighs 1 kilogram" Does it? For all substances?
"We could weight a 1 litre jug?" Sounds good.
After a few measurements the students worked out that the plastic bits we used, weigh around 0.3 grams per cubic cm. Can we can transform this graph to approximate our findings (as we did in Year 11)?
What do we need to do? Translate or Dilate? Vertical or Horizontal?
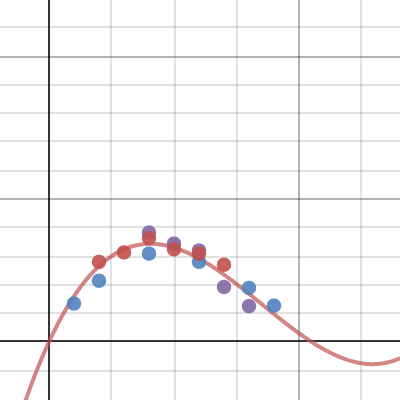
(Dilate Vertically, by multiply 0.3)
https://www.desmos.com/calculator/ykreaoty9d
What do we need to do? Translate or Dilate? Vertical or Horizontal?
(Dilate Vertically, by multiply 0.3)
https://www.desmos.com/calculator/ykreaoty9d
Finally my challenge was to find and create the maximum sized container. Using calculus techniques, the students found the stationary point at around 4cm.
The lesson covered geometry, graphing, transformation of functions, calculus and problem solving using both hands on and ICT tools as part of group work. Although it required considerable teacher direction, this lesson was demonstrated every aspect of a lesson I try to include in my lessons and it was a wonderful success.
No comments:
Post a Comment